Ecoweather
Real-Time Weather Insights for Sustainable Planning.
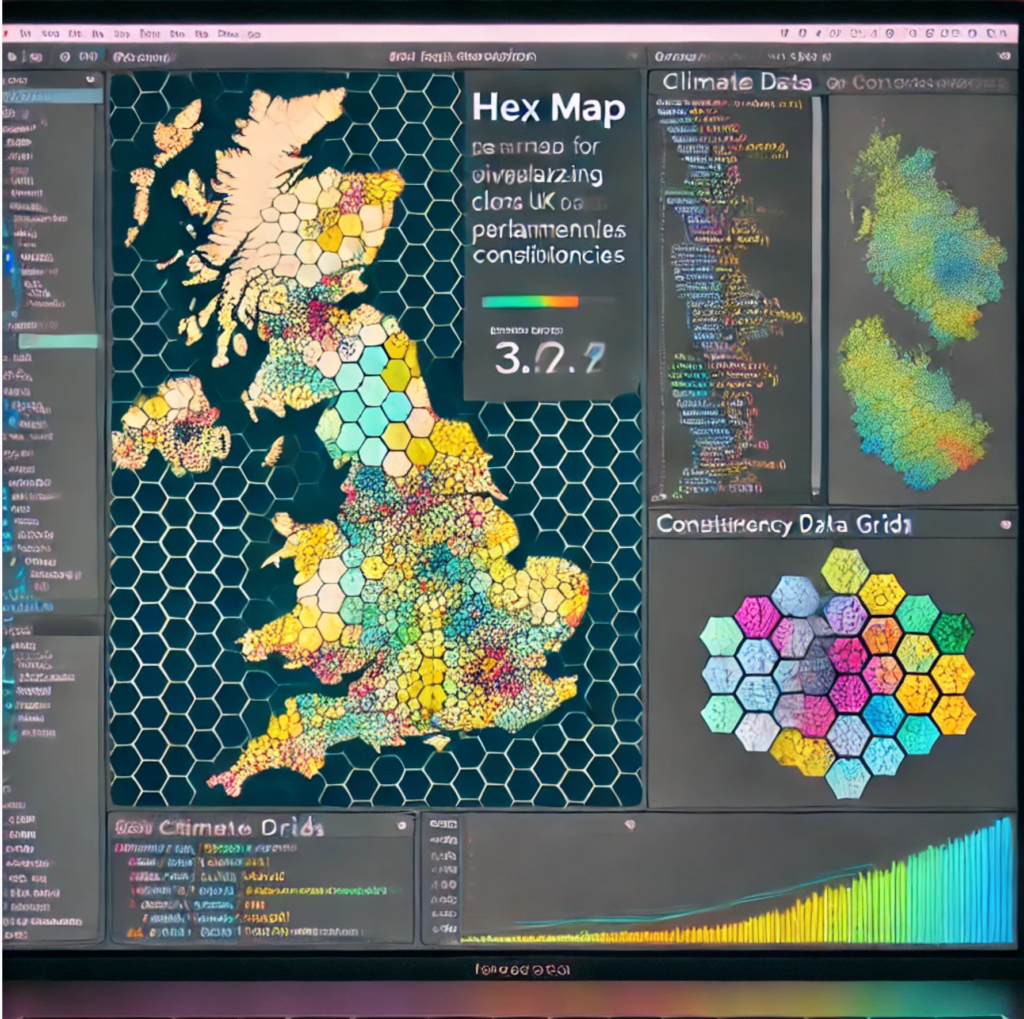
The “Ecoweather” project provides hexagonal maps to visualize climate data across North America (USA and Canada) parliamentary constituencies. It leverages Jupyter Notebooks and Python for processing and displaying gridded climate data, with an emphasis on regional analysis. The repository offers scripts for calculations at the constituency level and tools to create interactive maps. The codebase predominantly consists of Jupyter Notebook (79%) and Python (19.7%).
- Geometrical pre-processing to ensure data compatibility with EnergyPlus.
- Generating thermal zone object data for use in EnergyPlus.
- Executing simulations and managing the output results.
